UK accounts led foreign selling; KOSPI stress signals offer no timing guide
Hana's historical stress signals do not establish the odds of a rebound today. Daishin's allocation scenario estimates conditional capacity, not the timing of sustained foreign inflows.
Market data: Korea Exchange regular-session close & Hana Bank USD/KRW reference rate, 2026-11-11 (KST)
Five of seven KOSPI indicators were at or near historical extremes in Hana Securities’ Nov. 11 report, but those readings do not establish a floor or whether foreign net buying will persist.
The index closed Nov. 11 up 2.60% at 5,375.36. A day earlier, foreign investors became net buyers for the first time in eight sessions, with 450 billion won of net KOSPI purchases recorded in Kiwoom Securities’ Nov. 11 morning letter.
Who was behind the UK-account selling?
Foreign investors sold a net 214.0 trillion won of Korean listed shares in January–September 2026, according to Daishin Securities’ Nov. 10 analysis of Financial Supervisory Service settlement-basis data. UK-classified accounts represented 97.5 trillion won, or 45.6% (p. 2, Table 1). The UK classification alone does not identify the ultimate investors behind the trades.
The brokerage infers that hedge funds cutting borrowed exposure through prime brokers were a major selling channel. Its comparison of end-2025 IMF resident holdings with FSS country-attributed holdings predates the selling period. Neither that comparison nor the account totals identifies the 2026 sellers; the report acknowledges that public statistics do not disclose prime brokers’ total-return-swap positions (pp. 3–4 and 23).
What do the stress indicators show?
The five readings covered dividend yield, foreign net buying relative to market capitalization, drawdown, forward P/E and volatility. Forward P/B was 0.94x, above the historical low of 0.68x. Monthly average trading value divided by market capitalization was 0.54%, versus a historical extreme of 0.30% (Hana, p. 2, Table 1).
Expected 2026 dividend yield was 3.35%, the second-highest reading in the analysis. After historical dividend-yield extremes, median KOSPI price returns were 23% over six months and 42% over a year, excluding dividends.
Foreign-flow results are harder to interpret. Table 2 reports median cumulative foreign net buying over 12 months after dividend-yield extremes at minus 7 basis points of initial market capitalization. Table 3 records positive buying in all six cases over that horizon. Those results cannot describe the same sample under the stated definitions without an inconsistency; the report does not explain the difference.
Samples also vary by indicator and horizon, and the report does not establish whether recurring market lows across indicators were deduplicated. Its historical results cannot be treated as today’s rebound probabilities.
How much earnings weakness do chip valuations allow?
The valuation study uses earlier dates. The KOSPI fell 44.5% from June 22 to Nov. 6, while 2027 net-profit forecasts for 284 KOSPI companies rose 20.9% between June 19 and Nov. 6 (Daishin, p. 15).
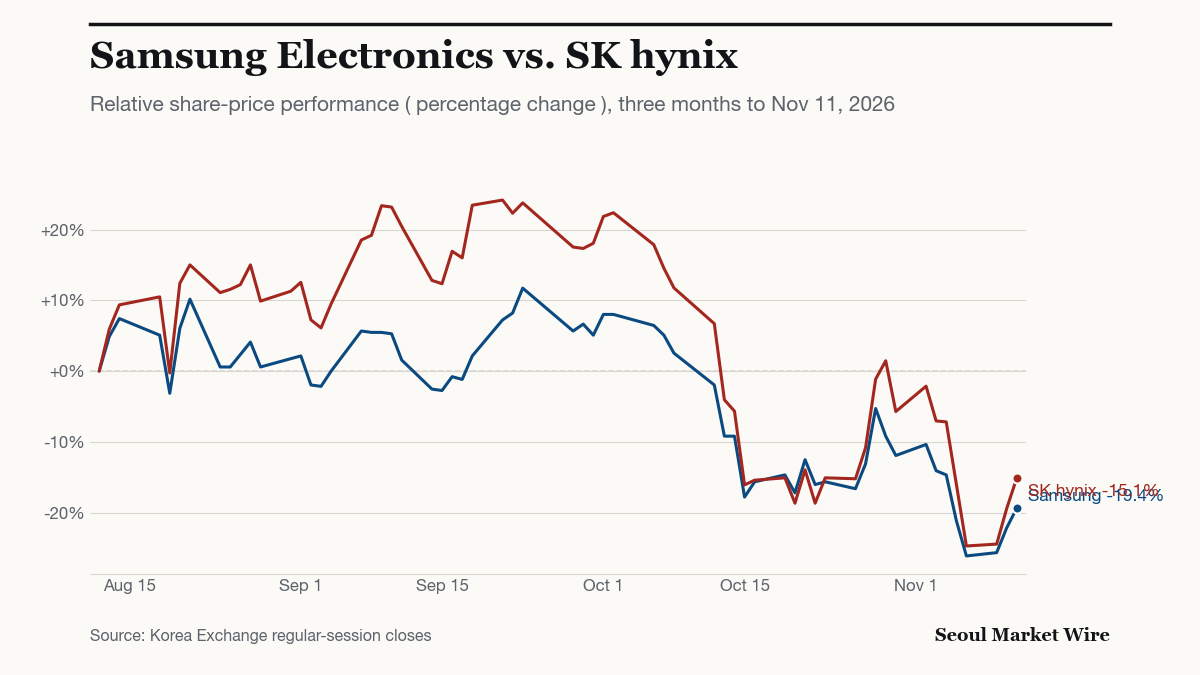
Samsung Electronics and SK hynix had a market-cap-weighted 12-month forward P/E of 2.4x on Nov. 6, versus a 2005–2025 month-end median of 10.1x (pp. 15–16, Figure 24). Peak earnings can depress memory-sector P/Es, so a low multiple alone does not establish undervaluation.
Using 50% of forecast earnings and a 5.6x P/E, the October 2018 low, the brokerage modeled the two chipmakers’ fair market capitalization at 14.8% above its Nov. 6 level. At 25% of forecast earnings, it was 42.6% below (p. 16, Table 4). These are conditional valuations of the two stocks.
Does lower volatility imply foreign inflows?
Annualized KOSPI daily-return volatility was 60.7% in 2026 through Nov. 6 (Daishin, p. 10). The allocation model assumes a 20% annual expected return, a 3% risk-free rate, and that 10% of estimated foreign holdings follows a rule setting equity exposure inversely to volatility. It also assumes exposure cut as volatility rose is restored symmetrically as volatility falls.
The estimated holdings base was about 1,645 trillion won, using Oct. 22 FreeSIS holdings adjusted to the Nov. 6 KOSPI level. A decline in volatility to 35% produced 121 trillion won of theoretical additional capacity. The 10% share is assumed, not observed (p. 17, Figure 26).
In monthly data for 2005–2025, the report found that lower 60-day volatility followed by greater foreign net buying was not statistically significant, with a t-statistic of minus 1.7 (p. 17).
Sources
- Daishin Securities — Reviewing foreign selling: re-entry scenarios under different volatility conditions (Nov. 10, 2026) stock.naver.com
- Hana Securities — Practical quant: a strong signal for phased buying (Nov. 11, 2026) stock.naver.com
- Kiwoom Securities — Kiwoom Morning Letter, Nov. 11 (Nov. 11, 2026) stock.naver.com
- Daishin Securities — Full report, Nov. 10, 2026 money2.daishin.com
- Hana Securities — Full report, Nov. 11, 2026 file.hanaw.com
1 more sources
- Naver Pay Securities — KOSPI daily index data finance.naver.com