Shinhan sees US debt-limit cash swings as a risk to 2027 funding
A post-election recovery does not remove funding risks. Shinhan's debt-limit scenario projects temporary cash injections followed by withdrawal after a deal.

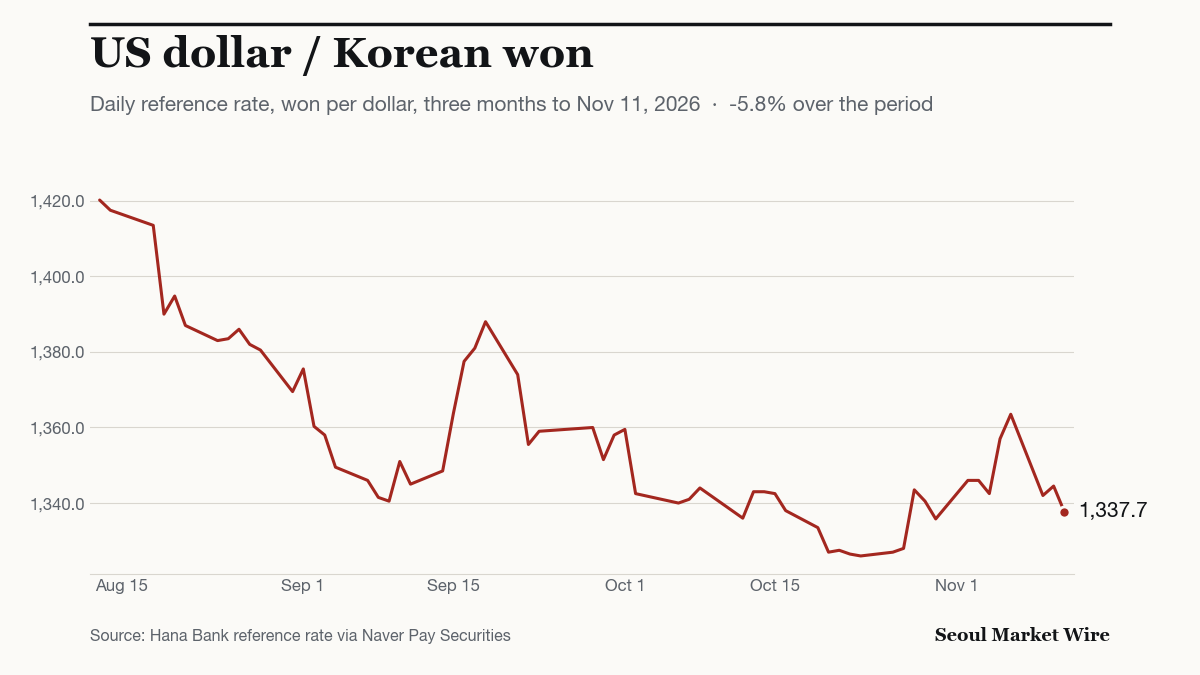
Market data: Korea Exchange regular-session close & Hana Bank USD/KRW reference rate, 2026-11-11 (KST)
US markets were recovering from the midterm-election shock, according to iM Securities’ Nov. 10 assessment, which linked lower Treasury yields to hopes of smaller deficits and an end to Federal Reserve rate increases after December.
But that recovery does not remove the risk of funding disruptions during a debt-limit standoff. In its Nov. 10 report, Shinhan Securities assigns a 60% probability to negotiations extending close to the projected X-date, with Treasury cash drawdowns temporarily adding liquidity before cash rebuilding reverses the flow.
When could the borrowing limit bind?
Treasury’s Nov. 2 borrowing estimates put privately held net marketable borrowing at $800 billion for January–March 2027, assuming a $1 trillion end-March cash balance. The brokerage calculates that debt-limit headroom was $754 billion on Nov. 3 and projects the ceiling binding in late first-quarter or early second-quarter 2027.
Those measures are not identical: a quarterly borrowing estimate cannot simply be subtracted from debt-limit headroom to establish a deadline. Reaching the ceiling also precedes the X-date, when available cash and extraordinary measures would no longer allow Treasury to meet all obligations on time, as GAO explains.
The report separates three political scenarios. It assigns 30% to an increase before the new Congress convenes, 10% to a deal under the new Congress before the ceiling binds, and 60% to a standoff extending close to the X-date. Its assessment rests partly on Republican divisions making an early agreement harder.
How would cash move through a standoff?
After reaching the ceiling, Treasury can use extraordinary measures and draw down its General Account at the Fed to keep paying obligations. In the standoff scenario, Shinhan estimates an $850 billion cash release over six months, easing short-term funding conditions during the drawdown.
That averages about $142 billion a month, roughly 3.5 times the $40 billion monthly pace at which the Fed began reserve management purchases in December 2025. This compares cash-flow amounts; it does not establish equivalent market effects or a change in monetary policy.
Payment risk can then work in the opposite direction. GAO documented higher yields on bills maturing near projected X-dates during past impasses. Separately, the brokerage expects the resulting increase in US bank reserves to support the South Korean won initially, with depreciation pressure emerging if risk aversion rises near the X-date.
After a debt-limit increase, Treasury would rebuild its cash balance. Its analysts expect the projected liquidity release to be withdrawn within three to four months. An earlier agreement would avoid the prolonged drawdown assumed in this scenario.
The effect on bank reserves depends on other balance-sheet movements. In the latter part of 2023, declining balances in the Fed’s overnight reverse-repo facility more than offset the reserve drain from Treasury cash rebuilding and securities runoff, according to the New York Fed’s operations report. That historical offset does not establish the size of any cushion during a future standoff.
What tests hopes for lower rates?
Treasury cash movements do not determine the Fed’s policy stance. Funding conditions can ease temporarily without ending the inflation pressures behind rate increases.
For Nov. 10, Kiwoom Securities’ Nov. 11 morning letter lists the US 10-year Treasury yield at 5.000% in its closing-yield table. That observation is distinct from the earlier decline discussed in the post-election assessment.
In its Nov. 11 report, Eugene Investment & Securities argues that the Fed would need to see monthly core inflation slow to around 0.2% before ending its hiking cycle. The report presents that threshold as its own policy assessment.
The BLS’s archived October release records seasonally adjusted core CPI increases of 0.3% month on month in each of August, September and October.
Sources
- Shinhan Securities — Checking the US policy environment after the midterm elections (Nov. 10, 2026), pp. 1, 5–8 stock.naver.com
- Shinhan Securities — Original report PDF (Nov. 10, 2026) stock.pstatic.net
- iM Securities — Financial markets recover from the midterm shock (Nov. 10, 2026), p. 1 stock.naver.com
- Eugene Investment & Securities — October prices: core +0.3%, December hike priced at 100% (Nov. 11, 2026), p. 1 stock.naver.com
- Kiwoom Securities — Kiwoom Morning Letter (Nov. 11, 2026), p. 1 stock.naver.com
5 more sources
- US Treasury — Marketable borrowing estimates (Nov. 2, 2026) home.treasury.gov
- New York Fed — Reserve management purchases (March 31, 2026) tellerwindow.newyorkfed.org
- GAO — Debt-limit negotiations and financial-market disruption (March 25, 2026) files.gao.gov
- New York Fed — Open market operations during 2023 newyorkfed.org
- BLS — October 2026 Consumer Price Index, archived release (Nov. 10, 2026) bls.gov