Meritz puts KOSPI 200 buyback capacity at 229 trillion won in 2027
Meritz estimates potential share purchases by KOSPI 200 companies at 229 trillion won in 2027, including employee compensation. The projection depends on cash flow and payout assumptions; it is not a tally of announced commitments.
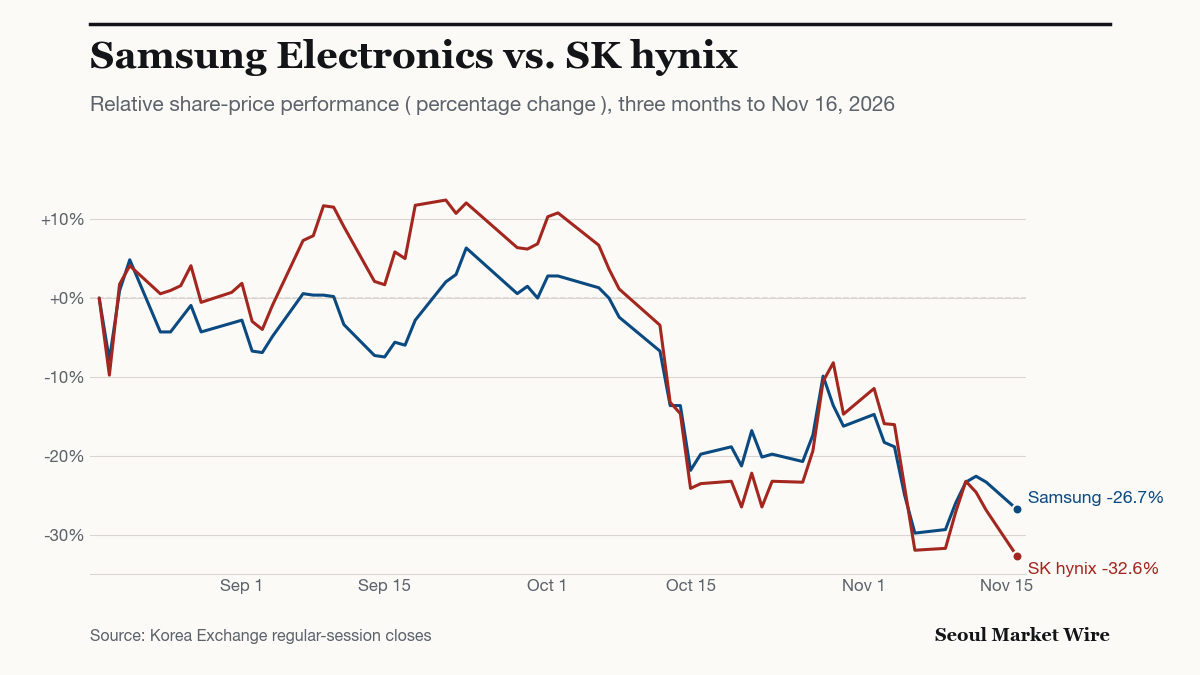
Market data: Korea Exchange regular-session close & Hana Bank USD/KRW reference rate, 2026-11-17 (KST)
Meritz Securities estimates that KOSPI 200 constituents could acquire 229 trillion won of their own shares in 2027, including purchases for employee compensation. Its Nov. 12 report projects 246 trillion won in 2028, but both figures measure potential purchases under modelling assumptions rather than announced commitments.
The distinction separates a possible source of equity demand from money already committed to the market. Earnings forecasts, cash available after investment and the allocation of that cash to shareholder returns all affect how much purchasing capacity becomes actual buying.
What does the 229 trillion won measure?
The estimate covers KOSPI 200 constituents rather than all Korean listed companies. It combines acquisitions for shareholder returns with purchases for employee share compensation. Those purposes belong in the same gross acquisition total, but they should not be described collectively as shares destined for cancellation.
| Forecast year | Estimated own-share acquisitions by KOSPI 200 constituents |
|---|---|
| 2027 | 229 trillion won |
| 2028 | 246 trillion won |
Source: Meritz. Both figures are model estimates and include employee compensation purchases.
Cash flow is central to the calculation. The brokerage’s assumptions connect shareholder returns at Samsung Electronics and SK hynix to free cash flow, while share-based employee compensation provides an additional source of potential purchases. An earnings forecast alone therefore cannot establish the amount available for buybacks.
For shareholders, three quantities need to remain separate: forecast earnings, the cash allocated to shareholder returns and the portion used to acquire shares. A change in any one does not establish an equivalent change in the others. Employee compensation purchases also need to be identified separately when assessing the purpose of the acquisitions.
The 229 trillion won estimate is consequently a scenario for company purchases across the index. It is not evidence that constituents have collectively authorised that amount, nor does it establish how much stock they will retire.
How does purchasing capacity become daily net demand?
Gross acquisitions count purchases before offsetting sales. Net buying subtracts sales from purchases, so it answers a different question about demand entering the market.
Alongside its annual acquisition estimates, the brokerage projects average daily net buying of approximately 0.9 trillion won in 2027 and 1.0 trillion won in 2028. These figures should be identified as net-flow estimates, rather than relabelled as daily gross buybacks.
The daily figures are averages, not a schedule of purchases. They do not specify the amount companies will buy in any particular session or establish that execution will be evenly distributed through the year.
The projections are also model estimates. Observed corporate net buying includes trades other than buybacks, so an exchange investor-category total cannot by itself confirm how much companies spent acquiring their own shares. Assessing execution requires comparing those flows with company acquisition disclosures and purchase reports.
The expected timing is conditional too. Meritz anticipates stronger company buying from late January 2027, around fourth-quarter results. That is the brokerage’s expectation, rather than a confirmed acquisition timetable for KOSPI 200 constituents.
Does market breadth establish buying capacity?
Different returns across Korean equities show why the headline index cannot answer that question. In its Nov. 17 market report, Kiwoom Securities calculated that the KOSPI had fallen 11.0% in November through Nov. 16, while the KOSPI 200 equal-weight index had declined 1.2%.
The indices differ in both weighting and constituent coverage. Their performance gap therefore cannot be attributed solely to weighting, and it does not show that companies outside the largest stocks have more cash available for purchases. It documents differing investment returns, rather than corporate financing capacity.
How exposed are earnings to AI demand?
Export exposure raises a separate issue about the earnings supporting that capacity. Hanwha Investment & Securities’ Nov. 16 macroeconomic report describes Korea’s AI-related export exposure as concentrated in memory, while Taiwan’s extends across servers and non-memory semiconductors.
That comparison concerns the composition of technology demand. It does not establish the amount of cash that exporters will retain after capital spending or allocate to share acquisitions. An export category associated with AI also does not demonstrate that every shipment within it serves an AI application.
Can memory earnings support the assumptions?
The semiconductor outlook contains competing influences on cash generation. Kiwoom’s Nov. 16 industry report expects pressure on conventional memory alongside growth in high-bandwidth memory, or HBM, which is used with AI accelerators.
Its analysts expect device manufacturers to reduce memory specifications as component costs rise. Their 2027 forecasts put DRAM content per smartphone down 2% year on year and NAND content down 1%. These are changes in memory content per device, rather than forecasts for total smartphone shipments.
The outlook also projects declines in conventional DRAM and NAND prices in 2028. Lower conventional-memory prices and rising HBM revenue would affect different parts of the chipmakers’ businesses; the price direction of one product category alone cannot establish the direction of total profits.
Assessing the effect on buybacks would require matching the two brokerages’ earnings, capital-spending, cash-flow and payout assumptions. The semiconductor forecast does not provide an independent calculation of Meritz’s acquisition total.
In the HBM forecast, the market expands from an estimated 81 trillion won in 2026 to 450 trillion won in 2028. Combined HBM operating profit at Samsung and SK hynix is projected to rise from 39 trillion won to 240 trillion won over the same period.
What to watch next
Meritz identifies late January 2027, around fourth-quarter results, as the window when company buying could strengthen. This is a forecast window for the broader market, not a verified earnings-release or buyback date for either chipmaker.
| KRX ticker | Key sensitivity | Next catalyst and date |
|---|---|---|
| Samsung Electronics (005930.KS) | Free cash flow after investment; allocation to shareholder returns and employee shares | Fourth-quarter results and any acquisition disclosures. Exact company dates are not established by the supplied sources. |
| SK hynix (000660.KS) | HBM and conventional-memory earnings; capital spending and payout allocation | Fourth-quarter results and any acquisition disclosures. Exact company dates are not established by the supplied sources. |
| KOSPI 200 constituents | Conversion of estimated capacity into disclosed purchases | Late January 2027: Meritz’s expected window for stronger buying, not a confirmed execution schedule. |
Sources
- Meritz Securities — Who will buy? Other corporations' buying capacity comes into focus (PDF dated Nov. 12, 2026) stock.naver.com
- Kiwoom Securities — Semiconductor industry outlook: When spring comes (PDF dated Nov. 16, 2026) stock.naver.com
- Kiwoom Securities — Weighing risk and reward as KOSPI 5,000 comes under threat (Nov. 17, 2026) stock.naver.com
- Hanwha Investment & Securities — AI dependence and non-AI (Nov. 16, 2026) stock.naver.com